On this page
The overview (Operations)
On the overview (in the menu: Analytics) managers get a steering layer above the personal tiles. A scope selector shows the figures for the whole organization, a category or a process type; a time window (7 / 30 / 90 days) sets the period. If your organization has no categories (or process types) yet, the scope stays selectable and says so: instead of a picker you get a hint with the way to the master data. This layer does not reload on its own: it shows the state it fetched when you opened the page. Next to the heading there is a Refresh button for that — one press fetches every figure of this layer anew, from health and SLA forecast to improvement opportunities, escalations, workload and value drivers.
- Health: how many running cases are healthy, at risk, blocked or stalled.
- Key figures: active and completed cases, overdue ones and an SLA-breach forecast. The forecast measures each running case against the norm of ITS template — the median of the last 20 completions. Templates with fewer than five completions are not counted; how many cases that affects is shown below the tile.
- Cycle time (median/p90) over the cases completed within the selected time window, plus a throughput trend. This is a reporting figure: the label names the window and the case count n stands beside it.
- Aging WIP: the oldest open, not-yet-started work and how much is unassigned.
- Slowest templates: a ranking by median cycle time.
Running and completed cases are never mixed: cycle time counts only completed ones, while open work appears separately as aging WIP.
The template workshop
Open a template and, at the top, “Workshop”. It shows how well this particular process is designed and executed — the analysis lives here because a template is a single, comparable intended definition.
- Cycle-time distribution: median, p90 and a histogram of the duration.
- Reliability on four axes: completion, on-time, unblocked, kept (not skipped).
- Hotspots per task: skip and block rate with sample size.
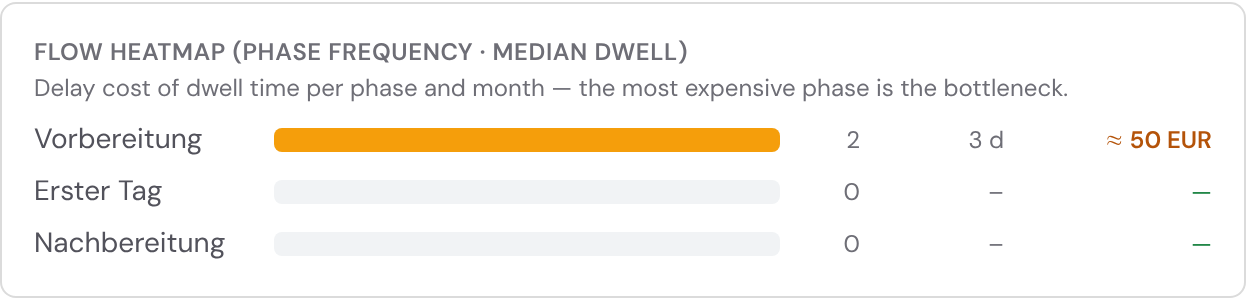
- Flow heatmap: how often each phase is reached and how long it takes on average. The same numbers can be laid straight over the flow diagram in the template editor via the “Heatmap” toggle — hot phases glow amber, each carrying its frequency and median dwell time. When cost rates are set, each phase also shows its delay cost per month — the most expensive phase is flagged as the bottleneck to tackle first.
- Variants: the paths phases actually took, with share — the most common one is the happy path.
- Version filter: because the Improvement Engine creates new template versions, your cases run under different snapshots. A switch at the top scopes the metrics to a single version — so an improvement you just applied becomes visible instead of being averaged away across all versions.
The Analytics view of a case
In a case, the single-case analysis is the third view in the switcher at the top: List · Diagram · Analytics. What is happening here, is the case stuck, and what to do now? The selected view is carried in the address bar, so the link takes a colleague straight back to it.
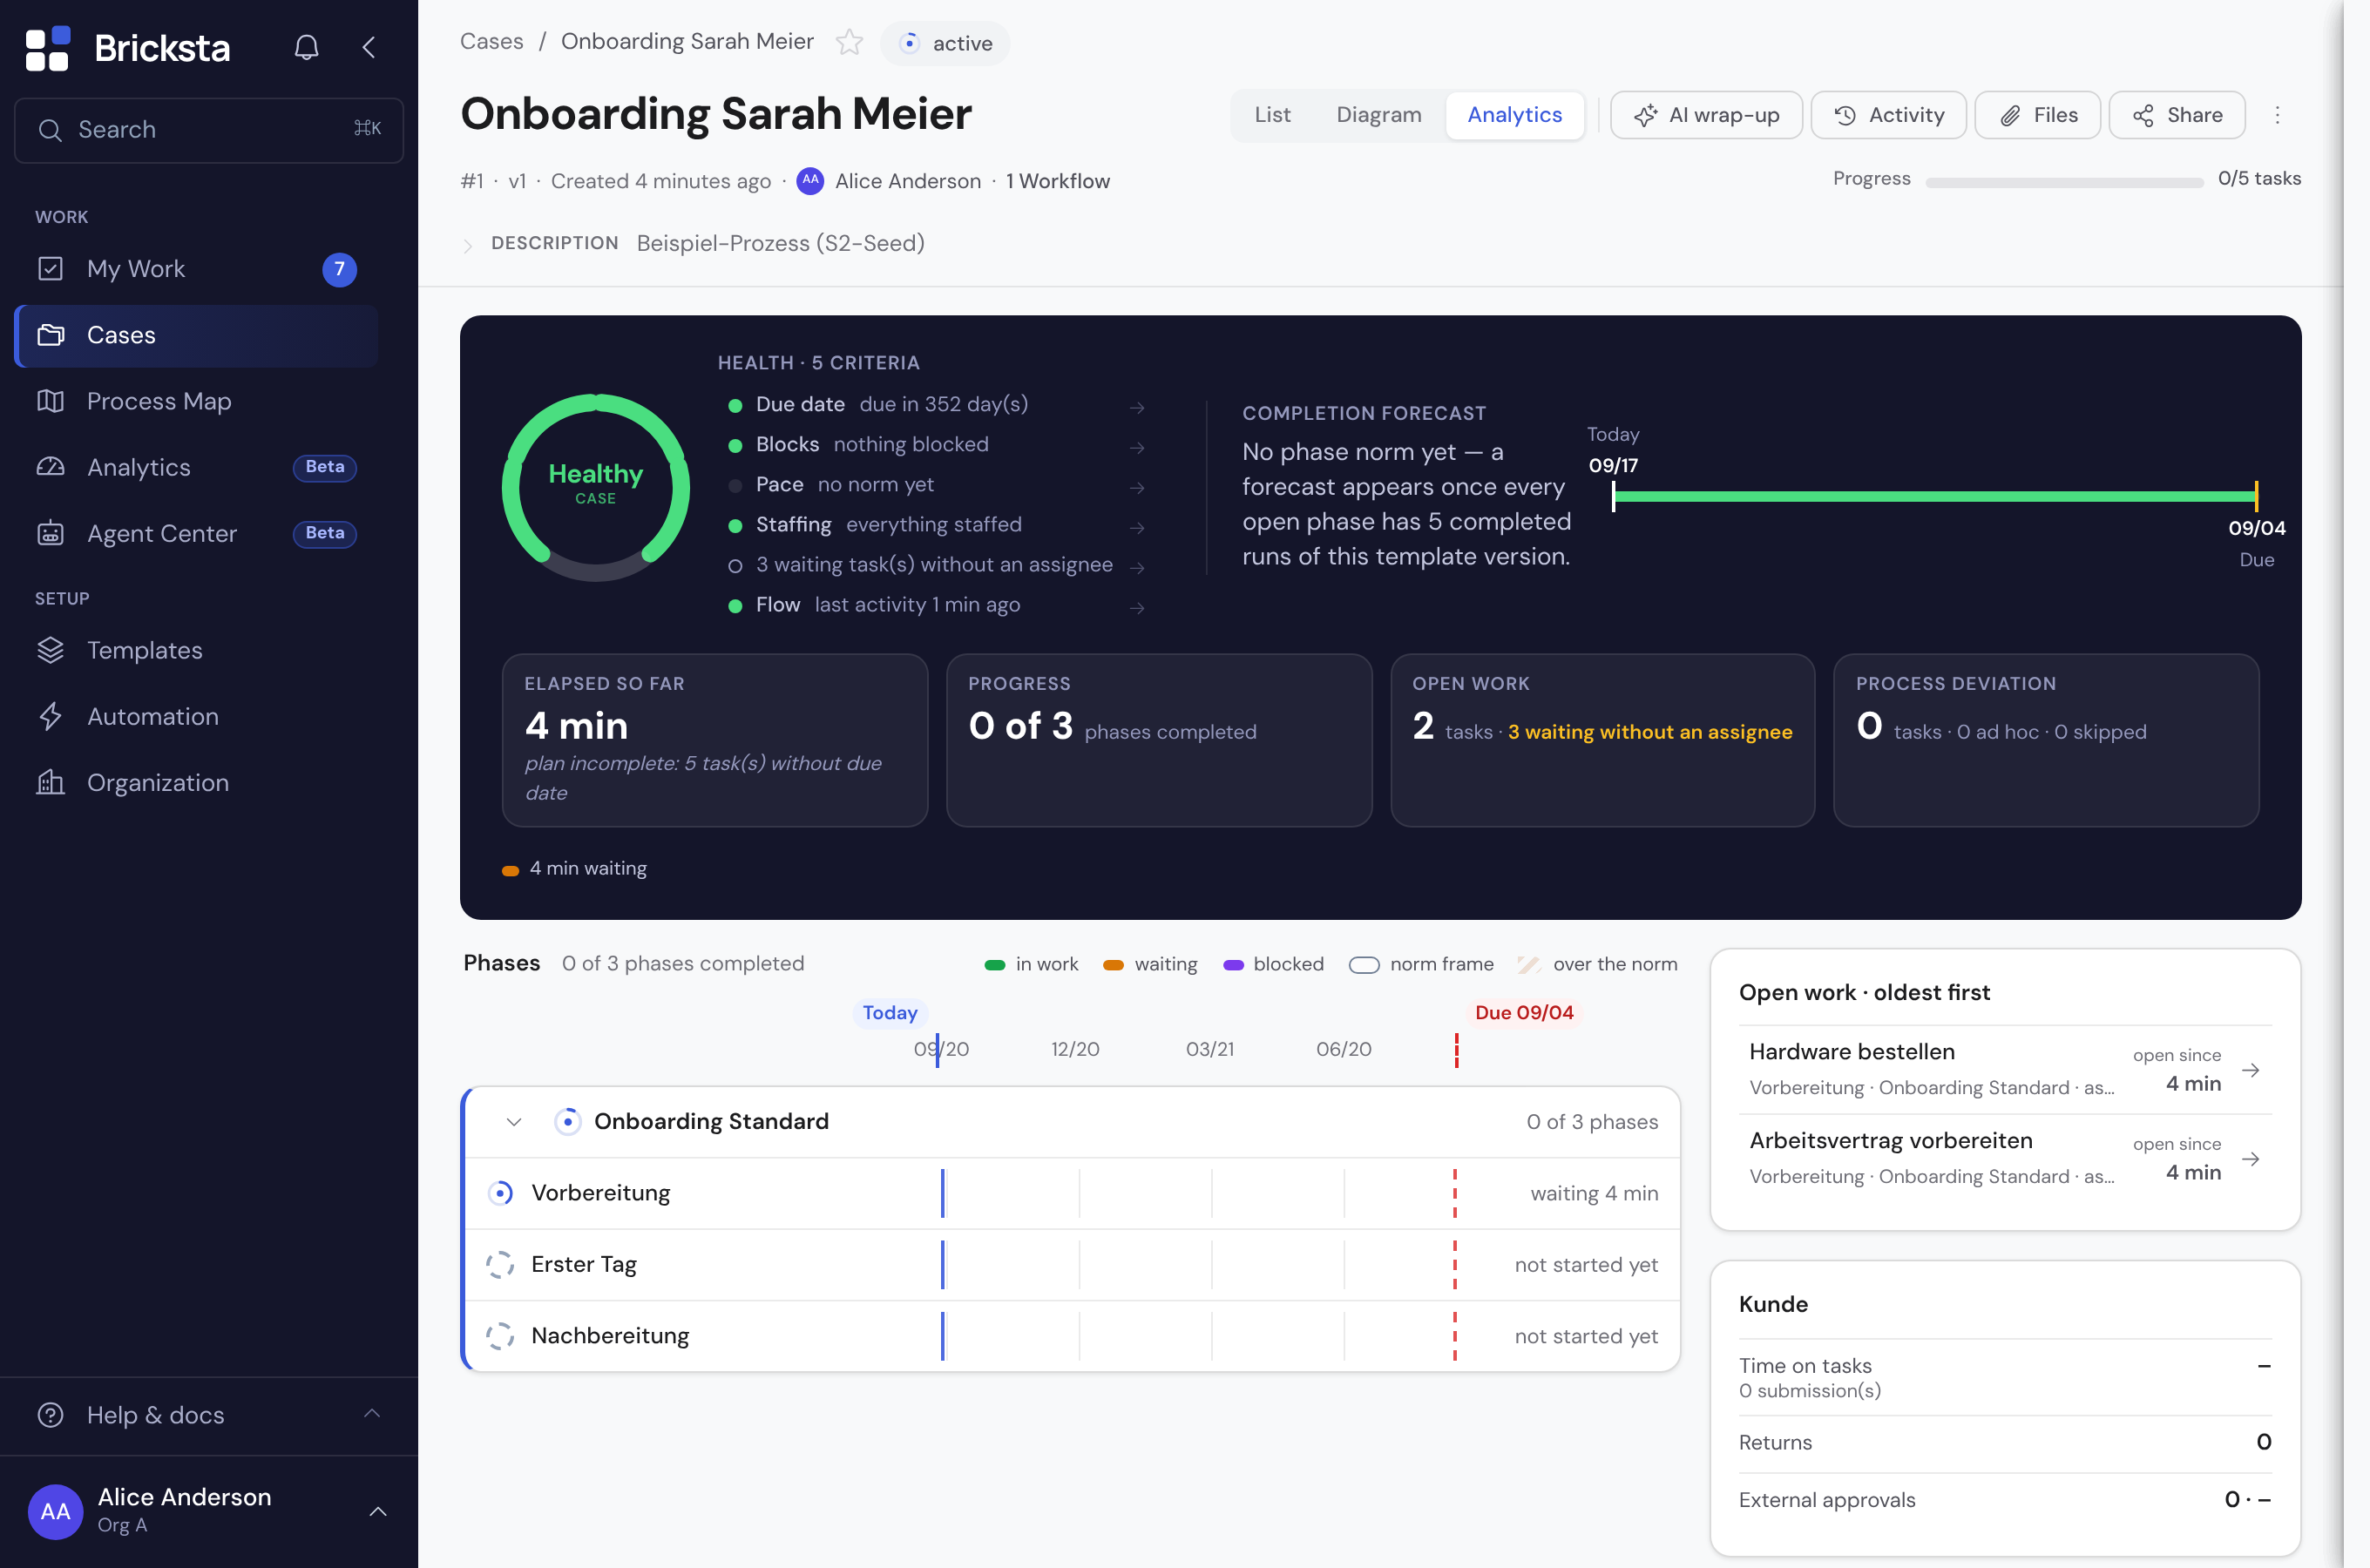
- Health now — as a ring of five fixed criteria: due date, blocks, pace, staffing, flow. Each segment is green, amber or red, and the word in the middle is the verdict: Blocked (a task is blocked), Endangered (the forecast lies after the due date, the due date has passed, or nothing is moving), At risk (only amber criteria: over the norm, unstaffed, an overdue task) or Healthy. Next to it each criterion states its reason, and the same verdict sits as a chip at the top right next to the case title. Each of the five criteria is a button (arrow at the end of the row), and the ring segment can be clicked too: “Due date” scrolls to the timeline and highlights it briefly, “Blocks” and “Staffing” open the “Open work” insight with the blocked or unstaffed tasks highlighted, “Pace” opens the “Progress” insight with the phases over the norm highlighted, “Flow” opens “Open work” (oldest first) with the overdue tasks highlighted. “Unstaffed” means: a released task (open or in progress) has neither a role nor a person — the header chip and the ring count the same tasks. Waiting tasks without an assignee, whose phase has not started yet, do not put the case at risk; they appear as a grey note line under “Staffing” (“2 waiting task(s) without an assignee”), and clicking it opens the “Open work” insight with exactly those tasks as separate “waiting” rows, each of which opens in the list where it can be assigned. The “Open work” tile also names the coming gap in its subline, in amber (“2 waiting without an assignee”), and the “nobody” pill in the row is amber — the tile's big number still counts only what someone can work on now.
- The forecast band at the top: the completion forecast as the eye-catcher, a timeline from creation over today and the due date to the forecast, plus tiles with the elapsed time against the template norm, progress (“3 of 8 phases completed”), open work (“5 tasks · 1 blocked · 1 unassigned”) and process deviation (“4 tasks · 2 ad hoc · 2 skipped”). Progress, open work and process deviation are buttons: a click opens a table underneath naming the phases, the tasks with assignee and age, or the ad-hoc and skipped tasks with their phase. Below it a bar shows how much of the elapsed time was waiting and blocked; waiting is summed over all tasks and can exceed the elapsed time — then the bar is full and the sum stands next to it. A further tile “Standing in the template” sets the elapsed time against the last 20 completed cases of the same template — the same group the norm comes from: “faster than the median”, “slower than the median” or “slower than 90% of the last 20 cases”, each with the number of cases. These are fixed reference points, not a rank; below five completions the tile is absent.
- If a customer has escalated, an “Escalations” tile joins them — the number of reports, with “open” or “resolved” below — and an “Escalation history” section appears under the band: first response (from the report to the team's first action, whichever it is), time until acceptance, number of questions asked and number of rejections, plus the events in chronological order with time, event and the person who acted. An escalation still running shows a dash instead of a zero under “Until acceptance” — a duration that does not exist yet is not claimed as a number; the same goes for the first response while none has happened. Where a case was escalated more than once, the figures measure the most recent report while the history still shows every event, and a note under the heading says so. The first response counts the team's earliest action, whichever it is — acknowledging, adding a measure, asking a question or proposing a solution. The tile tells three outcomes apart: “open”, “resolved” and “closed without a reply” — the last one where Bricksta closed the case itself after a week without an answer from the customer. Without an escalation, tile and section are absent altogether.
- "Act now": findings and the phase furthest past its norm appear as action rows with a jump to them. When there is nothing to do, the block is absent. When someone outside takes part through the portal, each open portal task without a submission gets a row naming the task, the person and the waiting time, with a "Remind" button that resends the invitation. The row calls that person by their role — "Bewerber:in" in a hiring process, "Lieferant" in procurement. When a case carries several roles at once, it says "External" instead, so the row does not claim one role for everybody. When a task is waiting for an external approver, a row "Approval" carrying the same role name tells you the task, how long it has been waiting since submission and the approver — when several people may approve, it names their number instead, so the wait is not pinned on any one of them; it takes you to the task, where you can change the address or withdraw the approval. There is no reminder there: an approver only receives the mail on submission, and a button claiming otherwise would be an empty promise. Under the open work, a card carrying the same role name sums up how long portal tasks lay outside, how many submissions and returns there were, and how many external approvals there were and how long they took — counted per round: a task that was rejected and submitted again counts twice, because the case waited twice; the time outside the house — portal tasks and external approvals — also appears as its own piece of the bar with waiting and blocked time. These are figures about the case, not about the person: no response time per person and no return reasons. When agents or automation work on the case, two more rows appear: "Action step" for a failed send or AI step with the number of attempts and the last error, jumping to the task; and "Agent waiting" when an agent asks for a plan or completion approval for its mission, jumping to the mission in the agents center, where the decision is made. The "Agents" card on the right names the case's automation share (the part of the tasks done by an agent or the system) against the template average; the case's own value appears only once at least two people have worked on it, because otherwise it would be one person's performance. Whoever manages the organization additionally sees the case's agent runs with tokens and the share of the monthly budget — for everyone else that row is absent.
- Findings about this case: what Bricksta itself has noticed about it — for instance that tasks are waiting on a role nobody holds in this case. Each finding names the problem, the recommendation that goes with it, and how long it has been open. Where there is none, nothing is shown: the view reports what was detected, it does not assure you that all is well.
- Completion forecast from the phases still open: today plus the norm of every outstanding phase — set against the due date. When the case completes a phase the date moves forward; when nothing happens it moves along with time. A phase norm is the median of its last 20 runs in this template version. When an open phase has no reliable norm yet (fewer than five runs), the forecast uses the provisional norm from the runs you are allowed to see and says so: “provisional forecast, its thinnest link rests on 2 runs”. Without even that there is no forecast; the view says from when one appears instead — no substitute figure is borrowed from a broader group. The forecast is the longest path through the open phases: the running phase with what is left of its norm, every further phase after its predecessors; phases without a dependency and parallel workflows run side by side, the longest chain sets the date, and the band says so. When a phase is already over its norm the date is an “at the earliest” — the band says that too. When a phase lies inside a review loop — between the target and the starting point of a back-jump connection — the forecast counts more than one run. As long as the loop has never run in this template, the estimate from the template applies (default: one and a half runs) and the forecast names “plan” as its basis. Once runs exist, the measured total duration of the loop takes its place — from the first entry to the final exit, not rounds times norm, because a second round is almost always shorter than the first. That is why the timeline shows, right of today, a dashed box per open phase: where it is expected to run, with start and end in the tooltip; phases not yet started name their expected start date in their row.
- The template norm (median of the last 20 completions) as the comparison figure — the same number the process map shows. If the template has fewer than five completed cases it is simply not there, rather than sitting empty.
- The template plan: the sum of task due offsets along the longest path — tasks within a phase one after another or by their dependencies, phases and workflows by their dependencies, the whole the maximum. Computed from the template state the case was started with; a later change to the template does not change its plan. The plan sits in the “Elapsed so far” tile next to the norm; where the norm is missing it is the yardstick, and the forecast adds up the open phases from their plan shares (“forecast from the template plan”). If a task on the path has no due date there is no number, only “plan incomplete: n task(s) without due date” — a partial sum would look reliable and be too short. The plan is not a norm: the norm is measured, the plan is promised.
- The phases on a timeline: one card per workflow (with a caret to collapse it), each phase with its status ring, its bar on the shared axis (waiting, blocked, in work) and its norm as a frame around the bar: how long the phase may take by the template. A bar inside the frame is within the norm; where it steps out, the excess is hatched and stands as a badge on the right (“+9 d”). Today and the due date run as lines through every card. Right of today stand the dashed forecast boxes of the open phases — for a running phase with a norm the norm frame carries the statement, the box appears there only when the forecast comes from the plan.
- Open work, oldest first, with phase, workflow, assignment and the age of the task (“open since 6.9 d”, counted from its release). Clicking a row switches to the list view and opens the task — straight from the observation to the action, without having to hunt for it.
- Process deviation: ad-hoc added and skipped tasks — what was not on the template's standard path, and what was left out of it.
- On the Analytics tab the header's property band (owner, due, priority, participants) is absent: due date and forecast are in the band, the owner sits in the line under the title. On List and Diagram the band stays — and there the due chip signals when the forecast lies after the due date: red with a dashed border (a forecast, not an overdue fact) and “Forecast Sep 25 · 11 day(s) after the due date” underneath. The signal needs the analytics right.
- The case's phases with progress, waiting time and blocked time — and, where a running phase is over its norm, by how much (“7 d over its norm”). These figures measure THIS case and stay even when there is no norm.
- Each phase sits as a bar on one shared timeline: phases that ran at the same time overlap on screen as well — two workflows started in parallel therefore look parallel, not like a chain. Segments inside the bar show what the phase time consisted of (waiting, blocked, in work). A phase that has not started yet is listed by name, without a bar.
- Once a phase has ended, its figures stand still. That holds for every way out of a phase — completed, skipped or cancelled — because its end is recorded rather than re-estimated on every call. Only a running phase counts up to now. Reopening a task puts its phase back into motion: the old end falls away, and the next completion is the one that counts.
- Clicking a phase expands its events — released, completed, blocked, skipped — each with its time and the person behind it. Where a phase has nothing to show, it says so explicitly. Events on the case itself belong to no phase; they are listed in full in the case activity.
Improvement opportunities
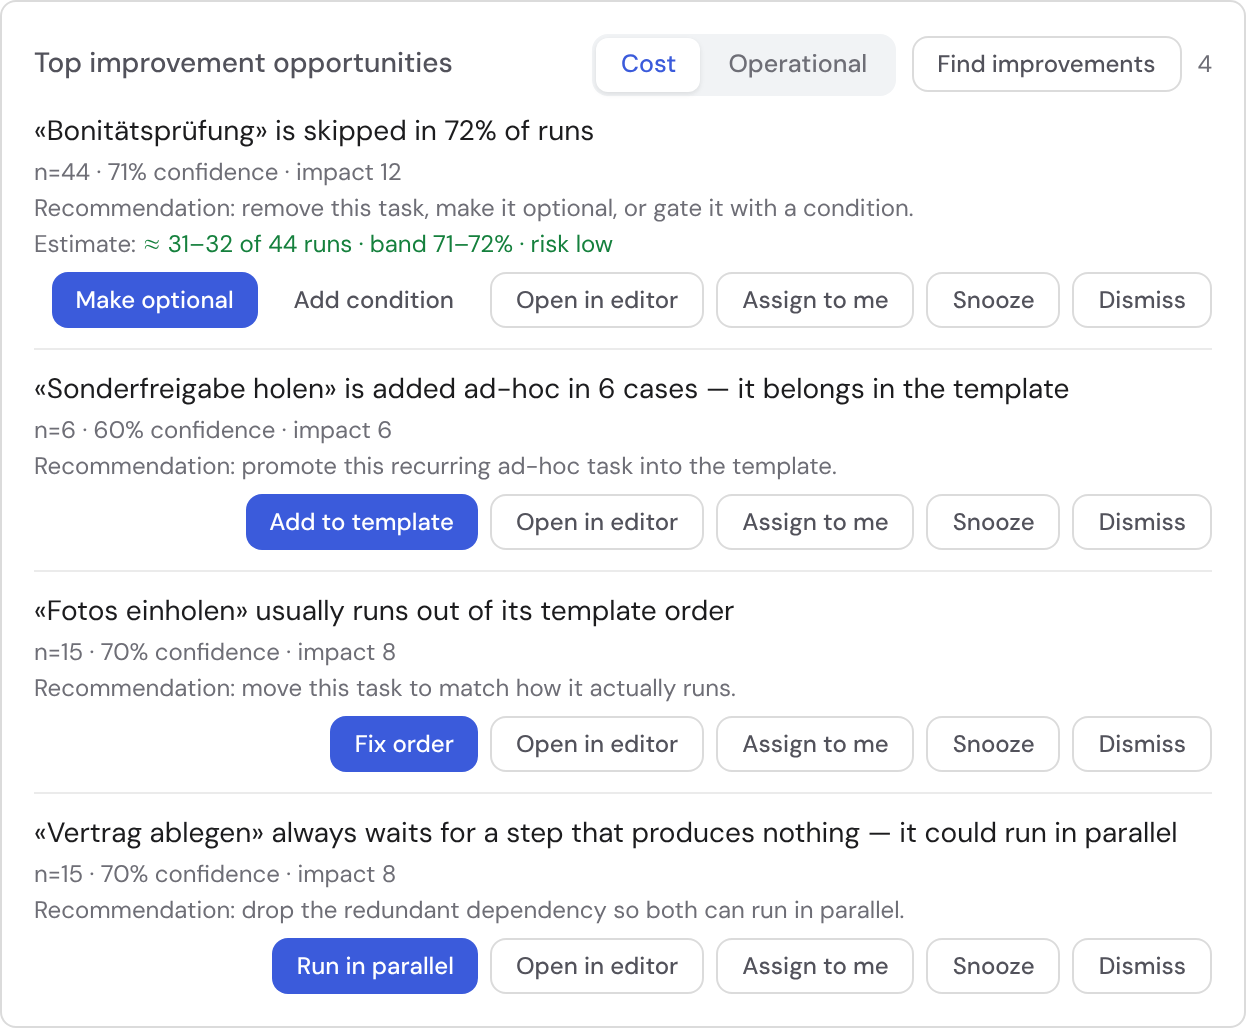
Bricksta detects recurring patterns and turns them into named opportunities — in the portfolio and the workshop as a “Top improvement opportunities” list. Each row names the problem in plain language. For rate-based opportunities (“in X% of runs …”) it also shows the statistical evidence — sample size and confidence — plus an impact value it sorts by (“what costs the most”, not “what happens to stand out”). For pure count opportunities (e.g. “unassigned tasks are piling up”) that statistic carries no information, so the row shows the actionable context instead (the affected template, and “elevated priority” where relevant). It also estimates the expected effect of a fix with a confidence band (e.g. “≈ 25–28 of 40 runs affected”) — honestly declared as an estimate, never disguised as an actual value. When cost rates are set, a euro value appears next to the impact per opportunity (see “Value drivers”).
Beyond these fixed detectors, you can trigger “Find improvements” in a template's workshop: Bricksta hands the aggregated metrics (never raw data) to the AI, which spots subtler patterns and proposes additional opportunities. Such AI opportunities carry an “AI” badge and a short rationale; they run through the same review, apply and measurement path as the rule-based ones — the template structure never changes automatically, only once you accept an opportunity.
- Skipped task: a task type is skipped in most runs — it should be optional or removed.
- Block hotspot: a task type is blocked unusually often.
- Unassigned backlog: several executable tasks sit unassigned and age past the threshold.
- Missing due date: a task type chronically runs without a due date — overruns go unnoticed.
- Rework loop: a task type is frequently reopened (a sign of a missing validation/approval gate).
- Dead branch: a conditional phase branch is never taken across many runs — the condition never fires.
- Role without execution right: a task type is assigned to a role that cannot complete it — nobody in that role can finish the task. Grant the role the completion right, or assign the task to a role that is allowed to execute it.
- Unstaffed role: a task waits for a role that nobody holds in this particular case. It looks like the entry above and is a different problem: the rights are fine — staff the role under the case's “Participants”.
- Key-person risk: a single person handles almost an entire task type.
- Capacity imbalance: one person carries far more open load than the rest of the team.
- Reassignment churn: a task type is reassigned over and over. These three people patterns are deliberately aggregate-only (never a name) and appear only when the comparison group is large enough (k-anonymity).
Every opportunity carries its evidence and can be handled directly:
- Confidence: rates are scored conservatively (Wilson lower bound), so “100% at 3 cases” does not beat “80% at 200 cases”. Opportunities below a minimum sample size don't surface at all.
- Simulate: an honest preview of a fix's expected effect, declared as a band (e.g. “≈ 25–28 of 40 runs”) — never as an actual value.
- Assign: give an opportunity to someone as an owner (“Assign to me” or hand it off) — or “Snooze” (defer) or “Dismiss”. The “All/Mine” toggle at the top of the list narrows it to just the opportunities assigned to you.
- Resolve: for “unassigned tasks are piling up”, “Resolve” takes you straight to those orphaned tasks — you assign them to a person or role individually or all at once in the same panel, without hunting through each case. A link also shows how to set a default owner in the template so it doesn’t recur.
- Apply: where the fix is unambiguous, one click is enough. This covers non-structural fixes (setting a sensible default due date) as well as individual structural levers right from the list: “make optional” for a skipped task (skipping it no longer blocks what follows) or “add condition” (the task only runs when a chosen data point meets a condition — otherwise Bricksta auto-skips it; you can also let AI suggest the condition with one click, then confirm it), “require approval” for a rework loop (a sign-off gate before completion), or “set owner” when ownership keeps bouncing (a pinned default role for the task). For a block hotspot, “set up escalation” creates a runtime rule in one click (if a task stays blocked, its owner is notified) — not a template change but an escalation rule you can fine-tune later. More structural levers work the same way: “add to template” turns a recurring ad-hoc task into a fixed task in the phase you choose, “fix order” moves a task to its actual execution position, and “run in parallel” drops a redundant dependency so two steps no longer wait for each other. A dialog previews the concrete change first; structural levers additionally require an explicit confirmation. Every apply creates a new template version and is reversible.
- Open in editor: structural opportunities without a (yet) one-click lever link straight into the template editor — you make the change there, with a diff and confirmation.
- Measure: after applying, Bricksta compares the new version to the old (before/after) and honestly shows “measuring …” until enough new cases exist — then improved, no effect or regressed. If a non-structural change (a default due date) measurably worsens the target metric, Bricksta automatically rolls it back and reopens the opportunity; structural changes are never auto-reverted — there Bricksta only flags the regression.
- Weekly digest: once a week a summary of the most important open opportunities arrives (in-app and by email), so the improvement backlog doesn't rot. Assigned opportunities go specifically to their owner; ones not yet assigned to anyone go to everyone with analytics access — so each person gets exactly their own open items instead of a blanket email.
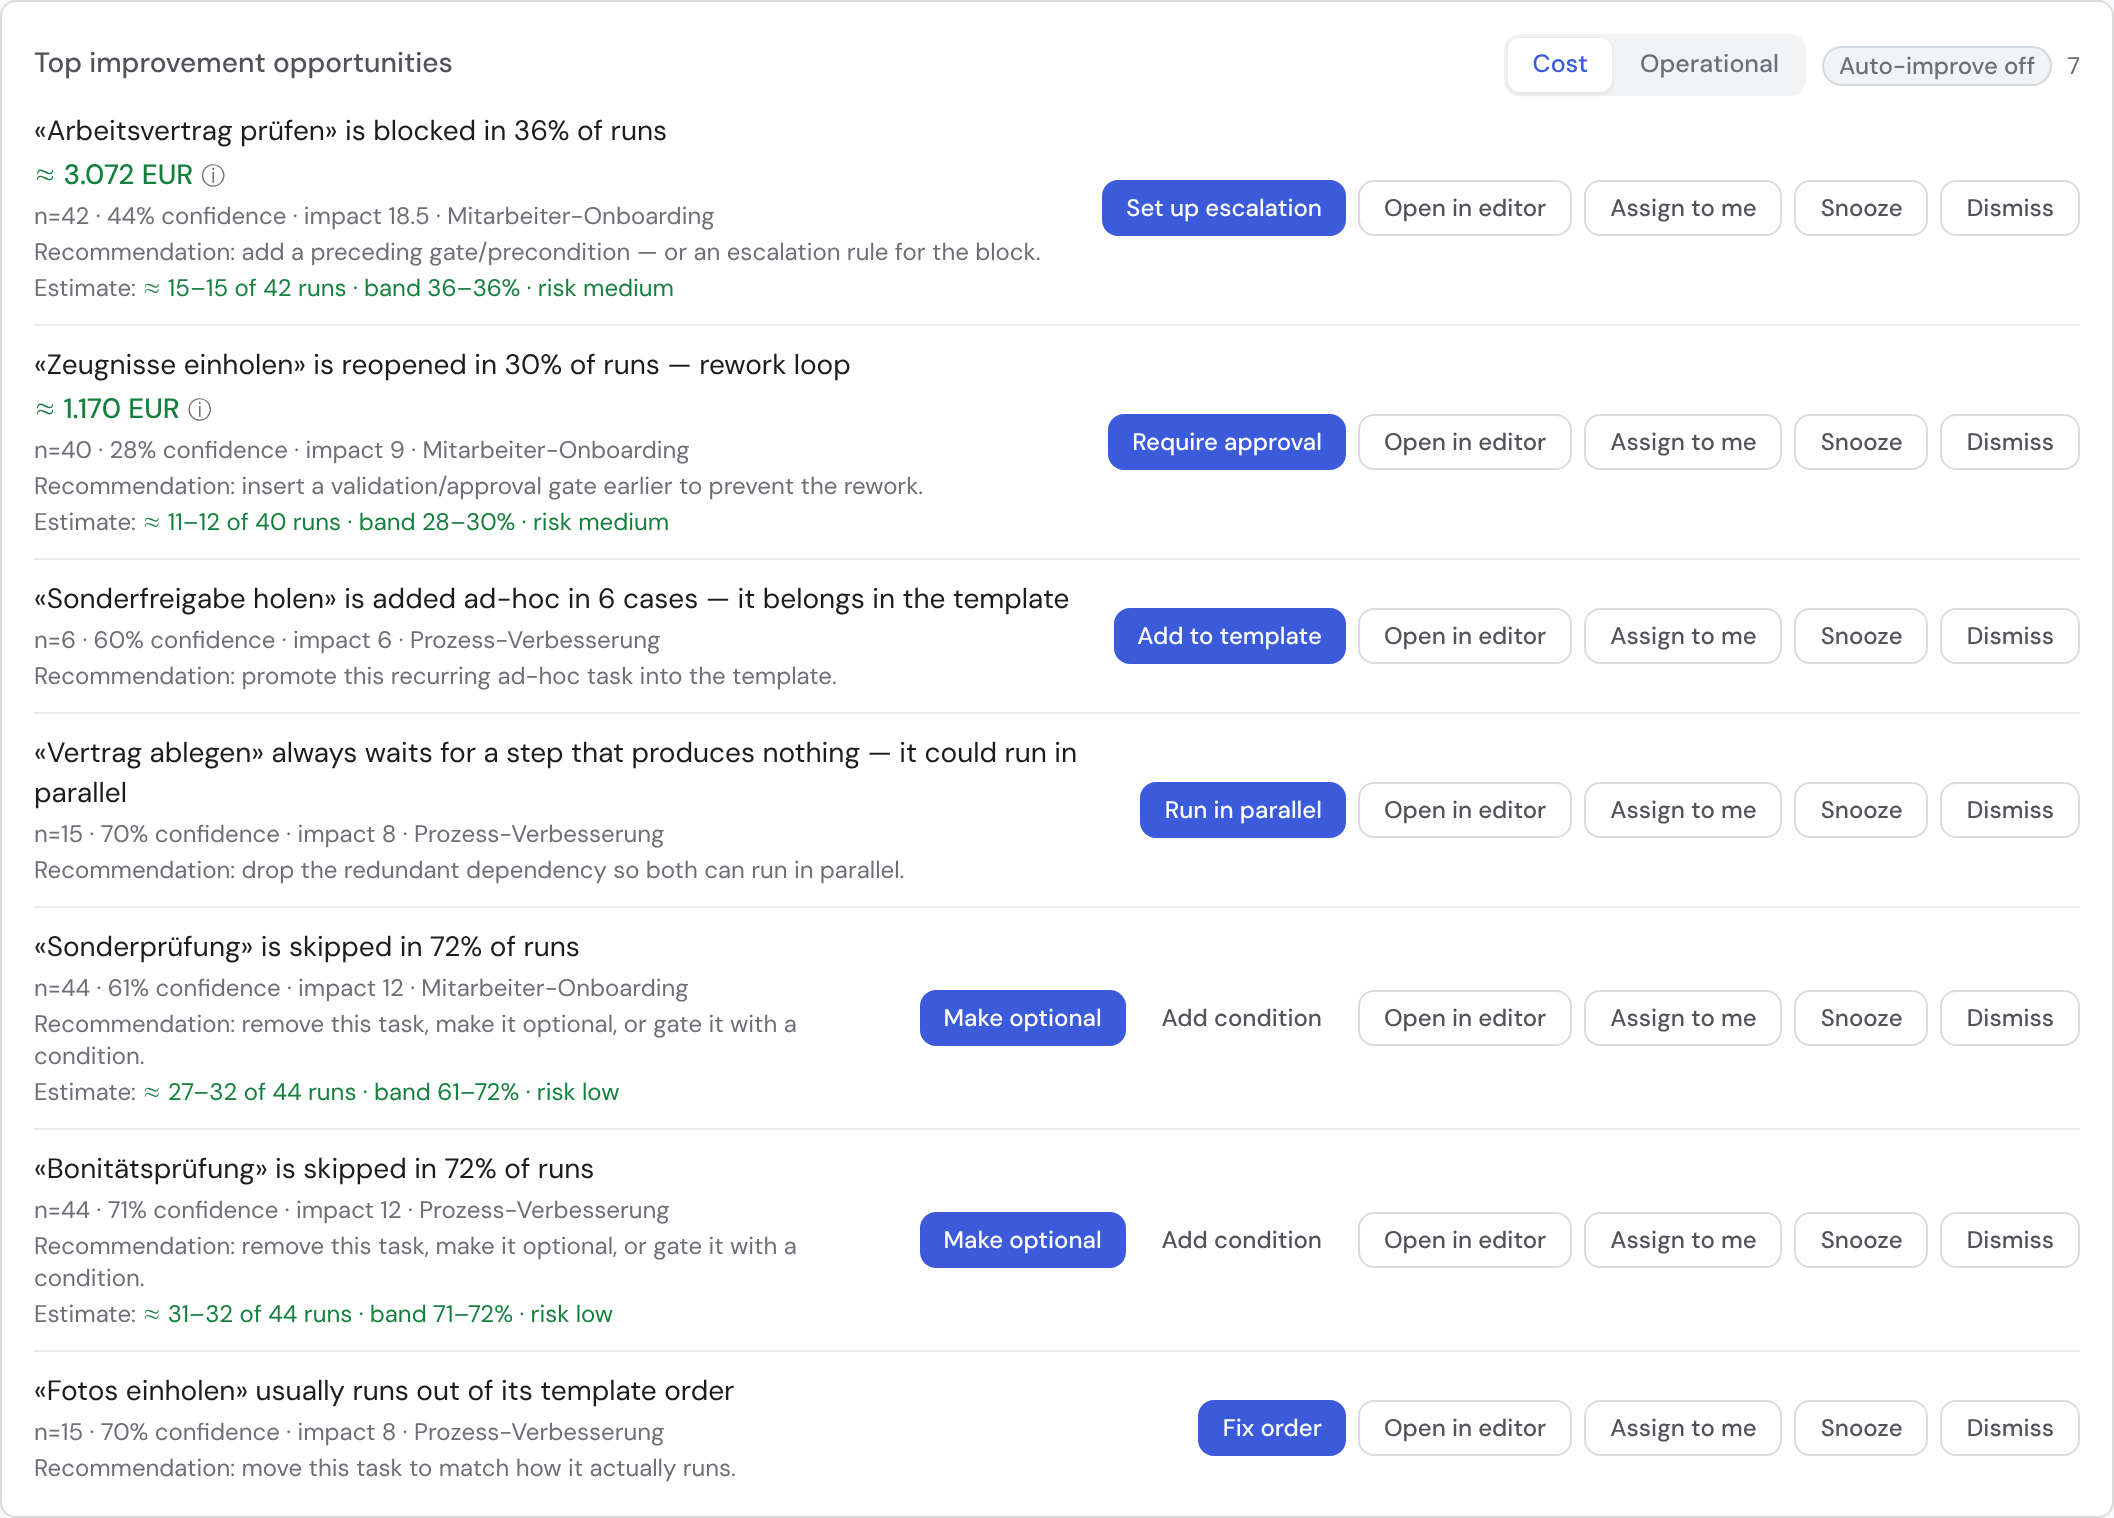
Structural changes to a template (removing a task, making it optional or gating it with a condition) are deliberately NOT applied automatically — you make those in the template editor, with a diff and confirmation.
The structural levers step by step
For the most common patterns, one click on the lever in the opportunity row is enough — a dialog opens that shows the concrete change and asks for an explicit confirmation. Every apply creates a new template version, leaves running cases untouched, and is reversible. If the underlying template definition has since been deleted, the lever is disabled and marked “(deleted template)” — it would apply to nothing, so you can dismiss the opportunity.
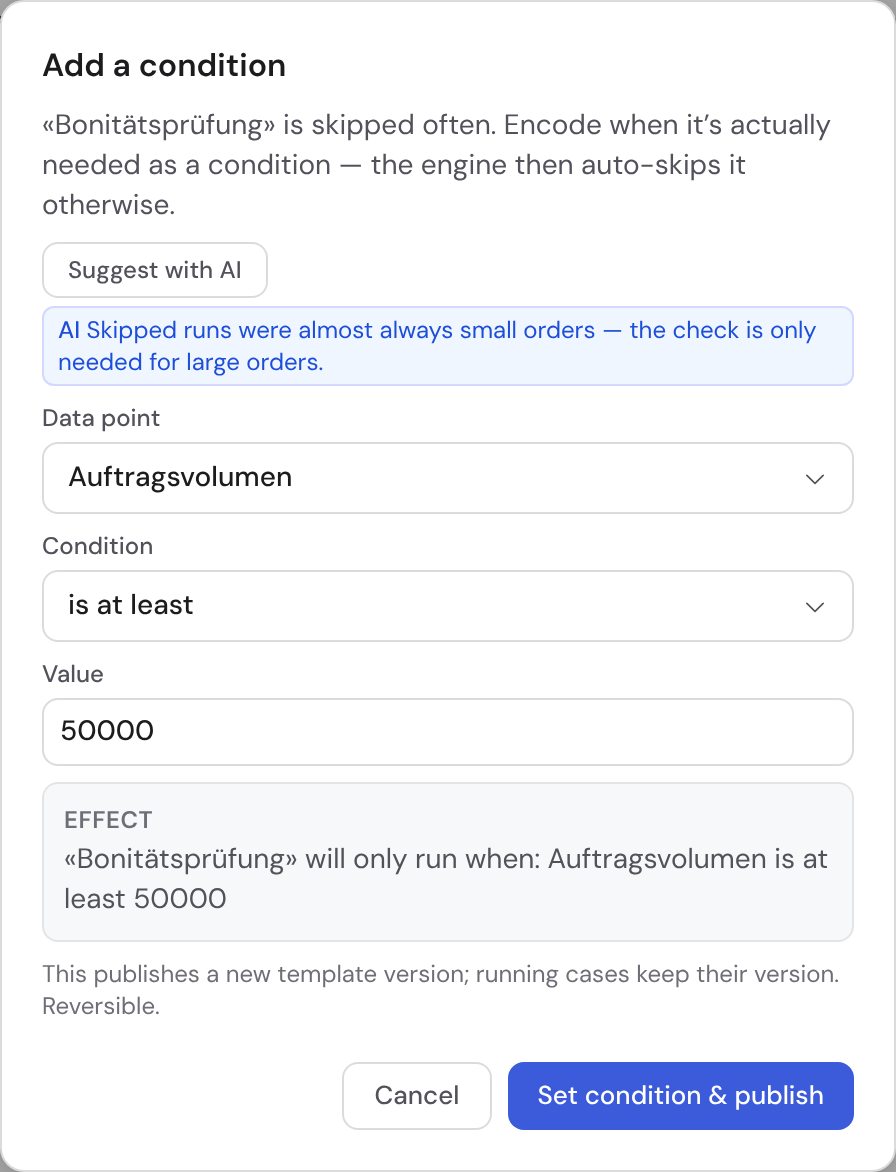
Add condition (for an often-skipped task): clicking “Add condition” opens the dialog where you pick a data point, a condition and a value. The task then only runs when the condition holds — otherwise Bricksta auto-skips it. The EFFECT line spells out the rule in plain language.
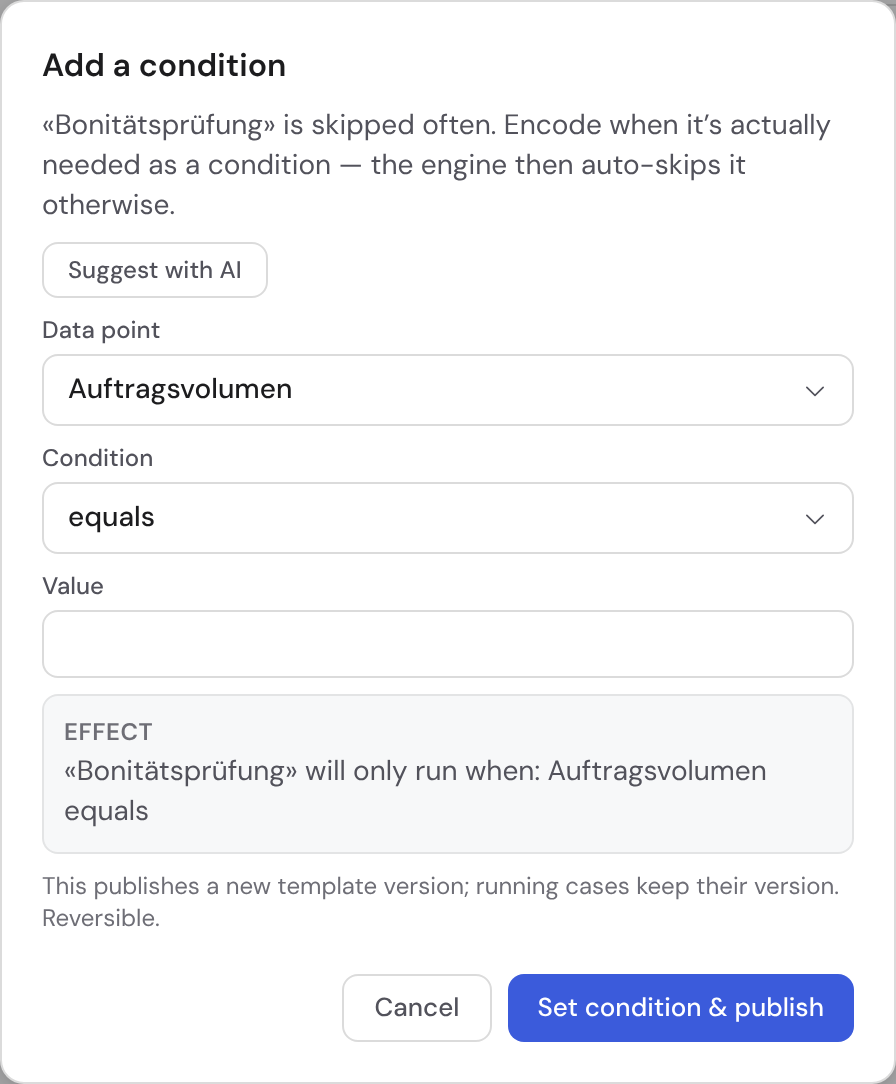
Suggest with AI: instead of choosing yourself, clicking “Suggest with AI” lets Bricksta derive a fitting condition from past runs and pre-fills the data point, condition and value — with a short rationale. You still confirm it yourself.
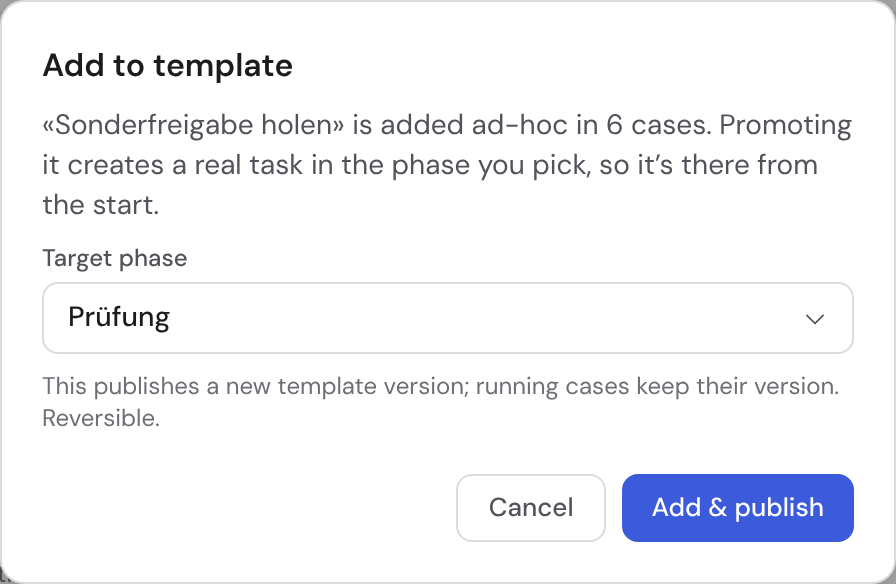
Add to template (recurring ad-hoc task): when a task keeps getting added by hand, “Add to template” turns it into a fixed task. In the dialog you pick the target phase where it will sit from the start.
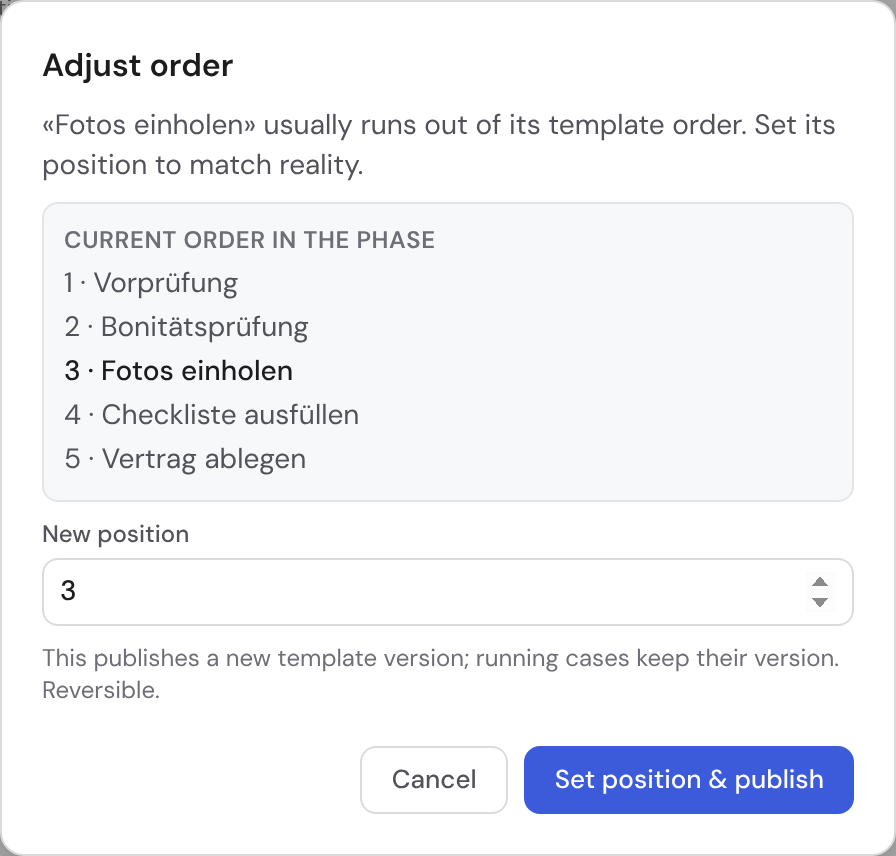
Fix order: when a task actually runs at a different point than in the template, the dialog shows the phase's current order and lets you set the new position.
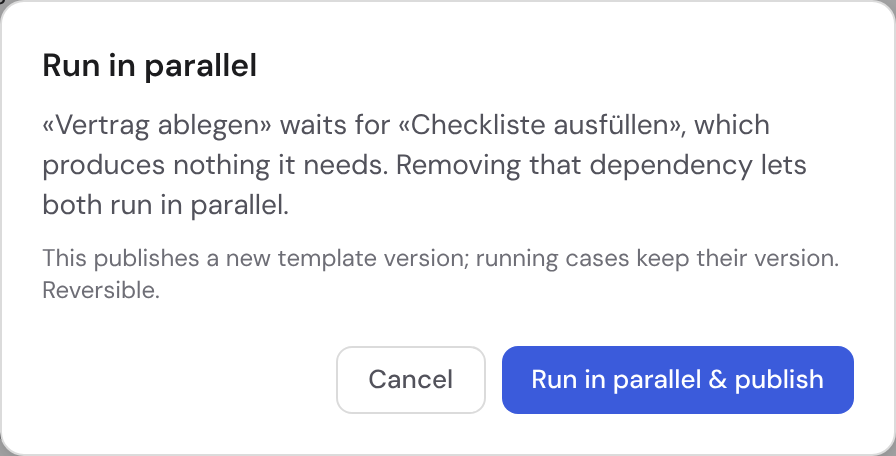
Run in parallel: when a task waits needlessly on a predecessor that produces nothing it needs, “Run in parallel” drops that redundant dependency — both steps then run in parallel.
Value drivers — opportunities in euros
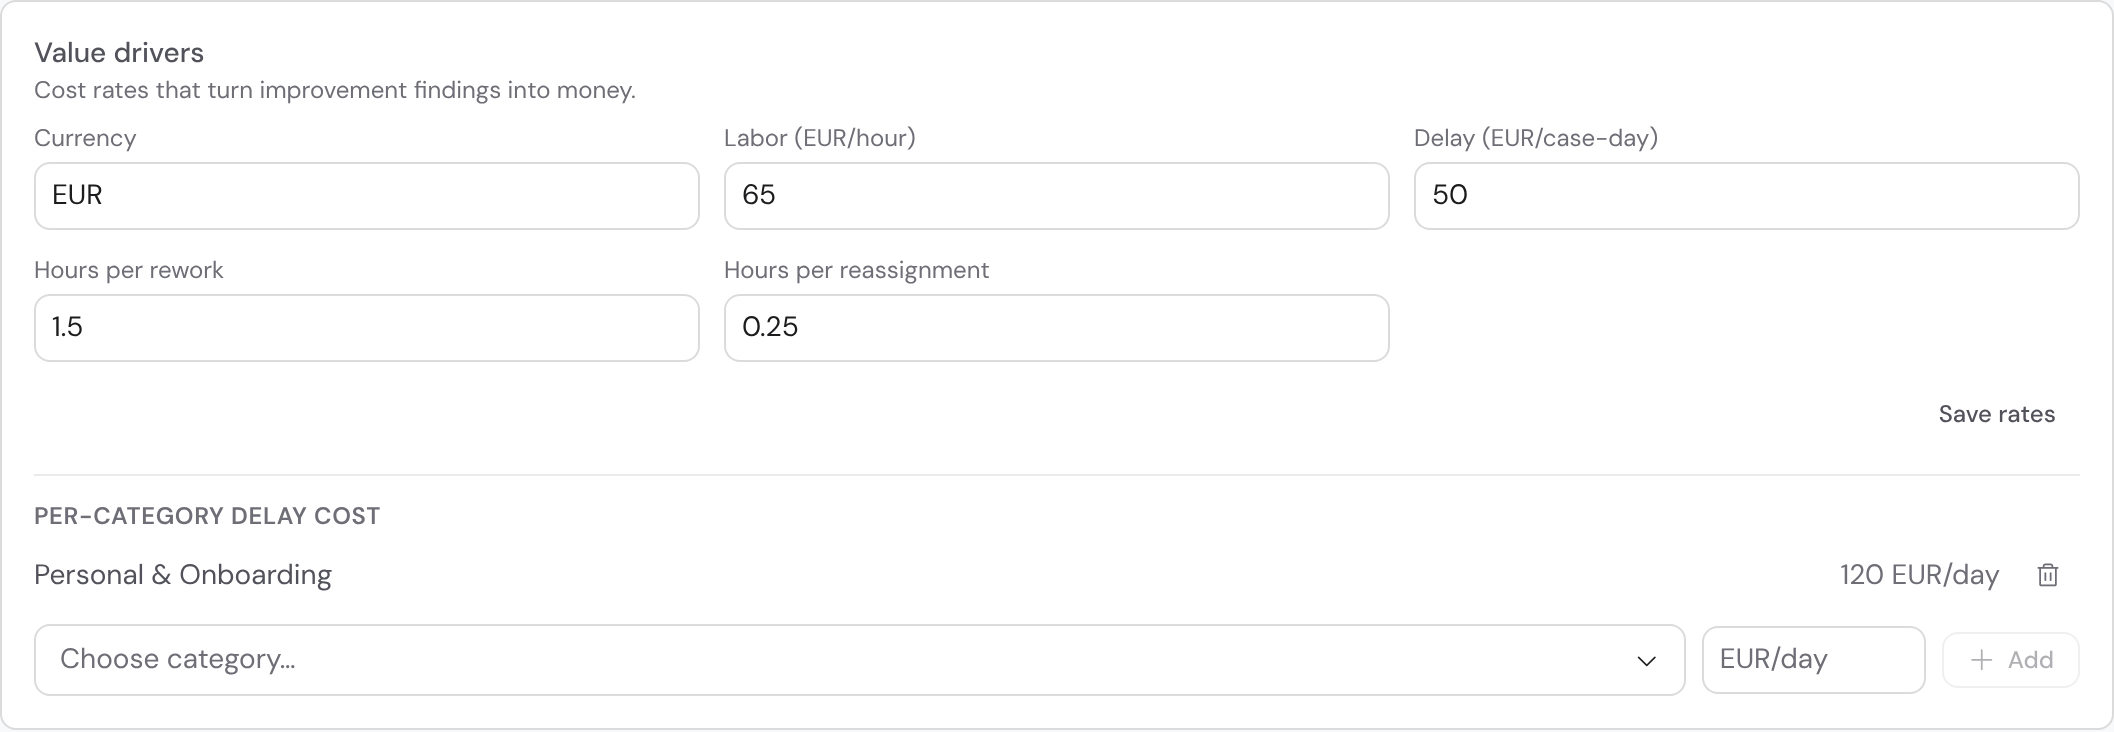
So that “what costs the most” isn't abstract, you can set cost rates in the portfolio under “Value drivers” (administrators only). Bricksta then translates the quantities measured from real time and delay data into money — following the pattern of established process-mining tools (a value-driver tree): a few rates, transparently broken down into their factors per opportunity. Nothing is invented — every amount is traceable down to quantity × rate (an info icon per row shows the breakdown).
- Rates: currency, labor cost per handler-hour and delay cost per case-day. Plus two transparent assumptions — assumed hours per rework and per reassignment — from which the event costs derive.
- Delay per category: the delay rate can be overridden per category (e.g. “Credit” costlier than “internal”) — that's where the business judgement lives.
- Delay opportunities (block hotspot, unassigned backlog, capacity imbalance): delay days × frequency × delay rate, weighted by priority — an urgent case-day counts more.
- Labor opportunities (rework loop, reassignment churn): count × labor cost × assumed hours — without a priority weight, because an hour stays an hour.
- Cost vs. operational lens: when rates are set, the opportunity list sorts by euros automatically; a toggle switches back to the operational order at any time.
- Bottleneck in the workshop: in the flow heatmap each phase carries its delay cost per month; the most expensive one is flagged as the bottleneck to tackle first.
- Weekly digest in currency: when a euro value exists, the weekly digest also names the euro potential of the open opportunities.
Honesty over completeness: opportunities without a real cost basis — pure clean-up hints (skipped task, dead branch, missing due date) or key-person risk — deliberately get NO euro value and are ranked by their business signal, not forced into a vanity number.
Escalations
While improvements shape the process over the medium term, escalation reacts in real time to a single case when a threshold breaks. You create rules — a trigger (“case blocked”, “at risk”, “stalled”, “overdue”, “task blocked”, “SLA breach imminent” = the forecast breaks the due date, “phase waiting too long” or “unassigned work aging”) plus a series of steps (notify, email, activity entry; and — with autopilot — reassign a blocked task or create a follow-up task) to a role, a team (group), a person, the owner, or the owner’s manager up the reporting line at a chosen depth (direct manager, skip-level or several levels higher). Each rule applies either to the whole organization or is narrowed to a category, a process type or a template; existing rules can be edited or deleted at any time.
A rule consists of:
- Trigger: one of the states above; for “task blocked” also a block threshold in hours.
- Scope: the whole organization, or narrowed to a category, a process type or a single template.
- Step chain: each step has a delay (after how many hours), an action and a recipient. Steps fire one after another as long as the situation persists.
- Actions: notify, email, activity entry — and with autopilot the two intervening actions: reassign a blocked task or create a follow-up task.
- Recipients: a role, a team (group), a single person, the owner, or the reporting line at a chosen depth (1 = direct manager, 2 = skip-level, higher). Groups only for notify/email; the intervening actions need a single assignee.
- Open escalations appear in the portfolio, with acknowledge and a jump to the case.
- Acknowledging stops the chain: no further step fires after that — including the steps to managers, the emails and any reassignment. The overview asks first, and the badge then reads “Acknowledged · chain stopped”. This cannot be undone.
- Per rule and case there is exactly one open incident — no duplicate ladders.
- When the situation clears (e.g. the case is unblocked), the incident resolves by itself.
Never a silent drop: if a step targets the reporting line but no manager exists at the required level, Bricksta doesn't quietly discard it — it logs a configuration warning so the gap stays visible (a later step can carry a role target).
You maintain the reporting line per member in their detail view (“Manager”), or directly in the org chart (Members → Org chart) via a node's ⋯ menu. For intervening actions Bricksta acts on behalf of the rule's creator — you don't need to pick a system actor.
Customer escalation
Not every escalation starts at a threshold: when a request is stuck, the customer can escalate it themselves in the portal (“Escalate your request”, with a reason and a short description). Every organization gets the rule “Customer reports escalation” for this — it is created together with the organization and is active from day one, with nothing to set up. It has four steps: it notifies the case owner right away, writes an activity entry, emails the owner's manager after 24 hours and creates a task for the owner after 48 hours — all of it only for as long as nobody acknowledges the escalation. You can pause the rule at any time (click the “Active” badge in the escalation overview) and adjust its steps, but you cannot delete it. For a category, a process type or a template you create your own customer rules in the rule editor with the trigger “Customer reports escalation” — at most one active per scope; the most specific one applies. You can give an existing threshold rule the customer trigger, but you cannot switch a customer rule back to a threshold.
- Visible at a glance: while the customer escalation is open, an “Escalation” chip sits next to the case title and the card on the case has a yellow background. Both disappear once the escalation is resolved. The card also names who reported it and, for every follow-up question, who asked and who answered — each with a timestamp.
- Acknowledge: the case shows a “Customer escalation” card with the customer's reason and text. The owner and members allowed to close the case acknowledge it — after that it no longer moves up, and the customer sees “In progress”. Bricksta asks first, because this cannot be undone: an acknowledged customer escalation cannot be restarted.
- Measures: record what is being done as a measure. Each measure is a real task in the active phase and is marked “Escalation” in the task list.
- Question: if the report is too vague, you ask the customer a question with “Ask the customer”. The escalation then waits for their answer, and the rule's steps pause. The customer gets an email with a link to the portal — the question itself is only shown there — and answers exactly once; after that the escalation is back in progress. If there is no answer within 7 days, you are notified. Each escalation allows at most 3 questions; presenting the solution withdraws an open question. After sending, the portal confirms to the customer that their answer has arrived and that the team will get back to them with a solution; question and answer stay there with their timestamps, even after a reload, and the “In progress” step names the time of the answer.
- Present solution: once all measures are done, you describe the solution. The customer gets an email with a link to the portal; only the person who escalated sees the text.
- Acceptance: in the portal the customer answers “Yes, solved” or “Still an issue” with a reason. “Still an issue” puts the escalation back in progress; from the second time on, the rule's next step is due immediately.
- No reply: after 72 hours Bricksta reminds the customer, after 168 hours the escalation is closed without a reply. The card on the case shows both times — and a warning if an email to the customer could not be delivered. Within 30 days after that, the customer can reopen it with “Still an issue”.
- Overview: in “Open escalations”, customer escalations carry the label “Customer” and their state (“Open”, “In progress”, “Waiting for acceptance”, “Still an issue”). They are acknowledged on the case, not in the overview.
- In the customer portal: on the “Your requests” home page, every request with an escalation carries a chip — “Answer needed” when the customer is up next (an open question, a proposed solution, or an escalation closed without a reply whose 30-day window is still running), otherwise “In progress”, and “Resolved” after acceptance. The chip only shows what the customer may also see on the case itself: a second participant on the same case reads “In progress” there, because they cannot answer.
- History for the customer: after acceptance the portal shows a collapsible “History of this escalation” — their own report, every question and answer, a rejected solution and the acceptance, in chronological order with timestamps. It names nobody from the team, and only the person who escalated can see it.
- Completion: while the customer escalation is open, the case cannot be completed or cancelled — the customer would be left without an answer, and they can still escalate again for 30 days after completion. The attempt is rejected and leads to the escalation. This also applies when the case would otherwise close by itself because its last task is done. Once the escalation is resolved, completion works as usual.
A customer escalation does not close by itself when the situation on the case changes — only through the customer's acceptance or after 168 hours without a reply. The customer never sees rules, steps, recipients or measures, only the state and the solution.
Autopilot (advisor-first)
Autopilot is the org-wide master switch that decides whether Bricksta merely advises on escalations or acts on them itself. Everything starts advisory: it is off by default. While it is off, Bricksta detects escalations and shows them to you, but nothing is sent or changed automatically — not a single step of a rule ladder fires on its own. Only once an administrator turns autopilot on does Bricksta start running the configured step chains itself.
Where to find it: in the portfolio (Analytics & Improvement) the “Open escalations” panel has a small switch in its top-right corner that shows the current state as a pill — green “Autopilot on” or grey “Autopilot off”. It is only clickable for administrators with the “Control autopilot/autonomy” permission; everyone else sees the state as a read-only label. A click flips the master for the whole organization, and the change is logged (who, when).
Autopilot works in three tiers, from harmless to intervening — each higher tier needs a more deliberate opt-in:
- Tier 0 (inform): notify, email, activity entry — the non-intervening steps. They run automatically as soon as the master is on. Without the master, even Tier 0 stays silent.
- Tier 1 (intervene): reassign a blocked task or create a follow-up task — real interventions in the case. On top of the master they need their own deliberate T1 opt-in; the master alone is not enough.
- Tier 2 (structure): changes to the template itself (removing a task, making it optional or gating it with a condition) — NEVER run automatically. This isn't a setting but is hard-locked in the system; you always make such changes in the template editor, with a diff and confirmation.
Nothing is lost: while autopilot is off, due steps aren't discarded but held back — the incident stays open and visible, and the ladder doesn't advance. If you turn autopilot on later, Bricksta works through the steps that piled up.
Autopilot can also take over improvements: with the T1 opt-in on in addition to the master (the “auto-improve” toggle at the top of Improvement opportunities, for authorized users only), Bricksta applies reliable non-structural fixes — setting a missing default due date — itself, logged as “by autopilot”. Structural changes always stay with a person. If an auto-applied change measurably worsens the metric, Bricksta rolls it back on its own (see “Measure”).
While autopilot is off, open escalations stay visible but no notification goes out and nothing is changed. When there are open incidents, a clear note right on the panel points out that it is only advising, not acting.
Workload — aggregate-first and opt-in
The portfolio shows open assigned load as “Workload”. By default only as a team aggregate by role — no names. Person-level metrics (load per person) are a deliberate org decision (co-determination / GDPR): an administrator enables them on the panel, and even then individuals only appear when the comparison group has at least k people (k-anonymity, default 5). Small teams stay hidden so a “team of one” cannot be de-anonymized.
Who sees what
The portfolio and improvement views are meant for managers. Analytics always respects visibility: it only aggregates over the cases you are allowed to see. Four permissions interlock:
- View analytics: base access to the single-case analysis. Without it, the “Analytics” segment does not appear in a case's view switcher at all.
- View org-portfolio analytics: access to the portfolio, improvement opportunities and escalations.
- Manage organization (administrator): set value-driver rates, enable person-level metrics, control autopilot, erase personal data.
- View person-level metrics: required to see workload per person — on top of the org-level enablement and k-anonymity.
Right to erasure: personal data can be removed on request — Bricksta pseudonymizes the person (aggregates and traceability remain, the person is no longer identifiable). Details under “Data privacy and retention (GDPR)”.